Phase Diagrams
Definitions:
PHASE: a homogenous, physically distinct portion of the system, e.g., liquid, solid,
gas.
COMPONENT: pure chemical substance, e.g., element or compound. H20 is
one component, a compound.
DEGREE OF FREEDOM: state variables which can be changed continuously and independently,
e.g., pressure, temperature, composition.
CONSTITUENT: the association of phases in a recognizably distinct fashion with a
distinct melting point, e.g., eutectic.
COMPOSITION: fraction of one component to all the components. May be in terms of
weight or atoms.
Phase Rule of Willard Gibbs
Let P = number of phases
Let F = number of degrees of freedom
Let C = number of components
These are related by the phase rule:
P + F = C + 2
Phase Diagram
The phase diagram is a map showing which phases of a material are in equilibrium
at any given temperature, composition, and pressure. It is drawn from experimental
data and may be used to determine at equilibrium:
the number of phases present (P)
the composition of each phase (X)
the amount of each phase present as a function of temperature and composition.
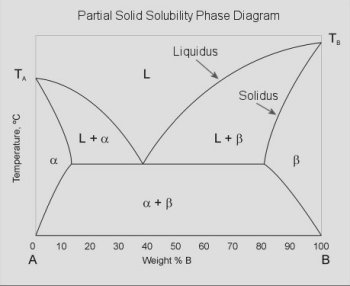
Of particular interest to integrated circuit fabrication is the binary partial solid
solubility phase diagram. The solidus curve can be used for determining the solid
solubility limit (Nsl) used in diffusion problems.
where:
L = liquid A+B fully intermixed
α = impure solid A (A doped with B)
β = impure solid B (B doped with A)
L+α = liquid A+B, with solid α
L+β = liquid A+B, with solid β
solidus = maximum composition where a solid solution (α or β) can exist
Note in the figure that for a binary phase diagram there can exist three degrees
of freedom (two components (C=2), at least one phase must be present (P=1), so F=3).
In order to present the diagram elegantly, the system is shown for pressure = 1
atmosphere (isobaric), leaving temperature for the vertical axis and composition
for the horizontal axis.
Composition
The composition, X, of a system can be defined two ways.
Traditional
where w = weight
Modern
where n = moles
Given the initial composition (xi) and weight (wA + wB)
of a binary system, the composition and weight of each phase can be calculated.
For the liquid (L), α, and β cases, the composition and weight are the same
as the initial composition and weight (only one phase is present). The two phase
regions (L+α and L+β) require the use of the Lever Rule to calculate the
weight and composition of each phase (solid and liquid).
Lever Rule
where
wS = weight of the solid (α or β)
wL = weight of the liquid (liquid A+B)
xi = original composition
xS = composition of the solid (α or β)
xL = composition of the liquid (liquid A+B)
xS and xL are found from the phase diagram
- xS corresponds to the intersection of the solidus curve with
the system temperature and is read from the horizontal axis
- xL corresponds to the intersection of the liquidus curve with
the system temperature and is read from the horizontal axis
|