|
ICS Plots
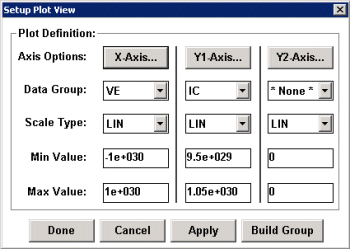
The data gathered by ICS can be plotted. Click on the Setup Plot View button
at the top of the main window.

The Setup Plot View window will appear with the setup information for the
currently active plot window.

You can add
or modify the plot axes by selecting the appropriate variable name under
Data Group. All data
that was selected to be measured in test setup is available
for plotting as well as any transform for the setup. You can also specify scale
type (linear, log, etc.) and minimum and maximum values of the scale.
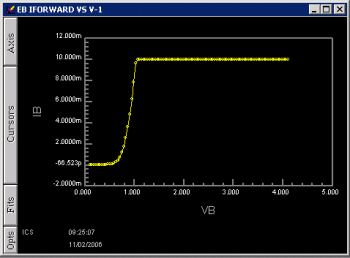
Adjusting Plots
The Plot window has a menu bar along the left side. To access the features
click on the appropriate menu item.

Axes can be autoscaled, cursors added, and linear line fits can be performed. There
are also options for the appearance of the plot, zooming, and overlaying multiple
plots.
|
|
Perform the following tests in order:
1.
2.
3.
4.
ICS Reference
·
·
·
·
·
·
·
IC-CAP Files
· Tutorial Model
· Hardware Setup
· Sample Tutorial Dataset
Data Sheets
·
·

 Download Adobe Reader to view the files.
Answers provided by this service may not be relevant to the materials presented in this website.
|